
This is the part nine of the post series about the Azure cloud monitoring options for telemetry data. Here the topic is:
- Azure Monitor Insights
Find the other parts under:
- Overview on Azure Monitoring-Part1-Intro
- Overview on Azure Monitoring-Part2-Levels and standard collection
- Overview on Azure Monitoring-Part3-Diagnostic settings
- Overview on Azure Monitoring-Part4-Virtual Machines
- Overview on Azure Monitoring-Part5-data sinks & costs
- Overview on Azure Monitoring-Part6-Log Analytics
- Overview on Azure Monitoring-Part7-Workbooks
- Overview on Azure Monitoring-Part8-Alerts
- Overview on Azure Monitoring-Part9-Insights
- Overview on Azure Monitoring-Part10-Examples
Application Insights
Under the name Insights, diverse monitoring options are combined. One candidate is already a bit “older”: Applications Insights. A tool that could fill an entire book on its own. In contrast to the other Insights options, it is provisioned as an extra resource (although it already can also be deployed as part of a Log Analytics Workspace) and linked for example to web applications in the cloud or on-premises. Another use case is the integration with Azure Functions. AppInsights already comes with a lot of features by default, such as capturing exceptions from the code, tracking page views and their loading or response times and error codes. Advanced host disgnostics or the representation of request origins would be additional features. Distributed tracing can be used to draw application maps that can be used to track a user request from the front end to a database or storage call.
Example Application Map:
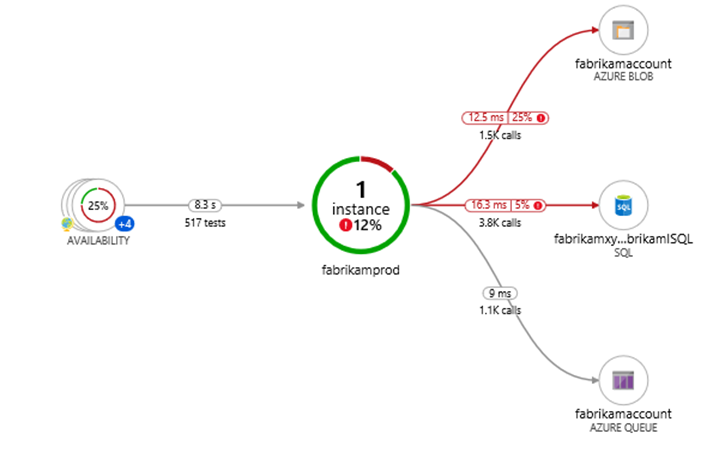
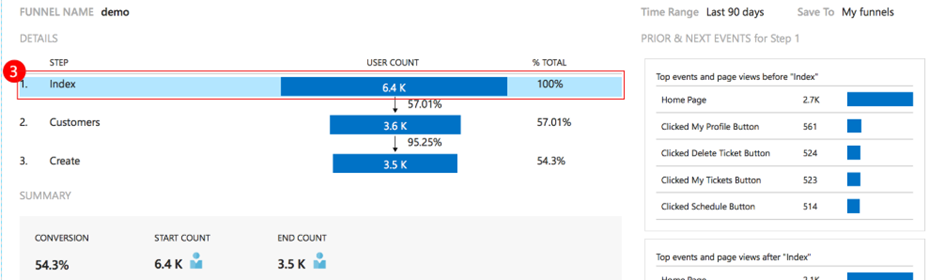
Various SDKs are available to track individual business events and metrics. This also enables advanced functions such as information about user return rates and the configuration of funnels to measure success rates of a user journey – useful, for example, in an online shop application. To define funnels, you make use of tracked custom events like “order put in basket” and “purchase clicked”.
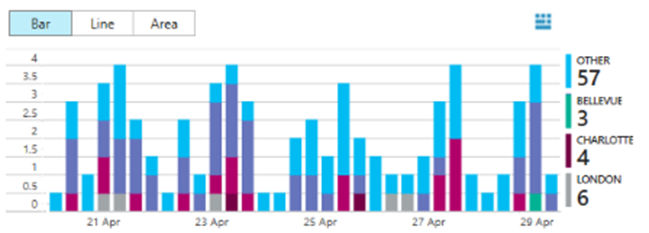
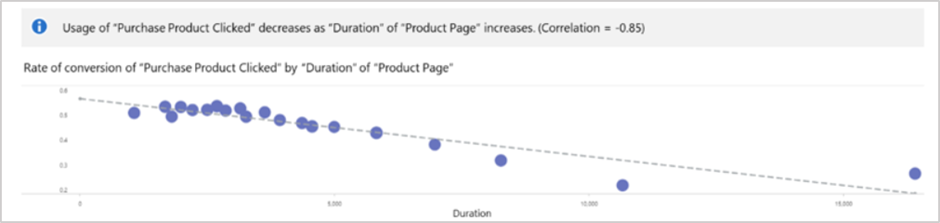
Other nice features are displaying of requests origins or the impact analysis, which can help to get information about the connection of page loading times related to tracked events.
Find more information under AppInsights
“new Insights”
For a while, there have also been other insights for different resources that are automatically available, with some requiring some configuration work and a Log Analytics Workspace, such as Container Insights to monitor an AKS cluster or VM Insights.
Workbooks that use metrics and logs to help analyze your resources are a central piece of these solutions.
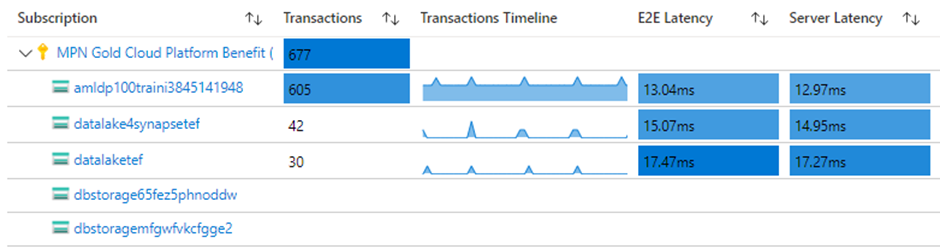
Storage Insights can provide a quick overview of transactions, storage allocation, and access latency of all storage accounts in the tenant, without the need of configuring disgnostics settings and digging yourself through KQL logs. The key vault counterpart provides access quantities and error rates, among other things. This also makes these two Insights variants interesting when weighing up the activation of additional Azure Defender protection for resources, as this makes it quick and easy to estimate the cost of it.
Storage Account Capacity
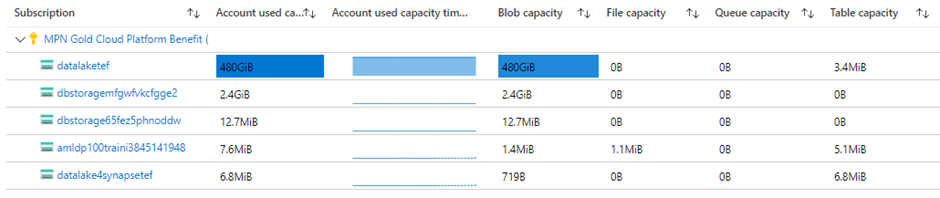
& Transactions:
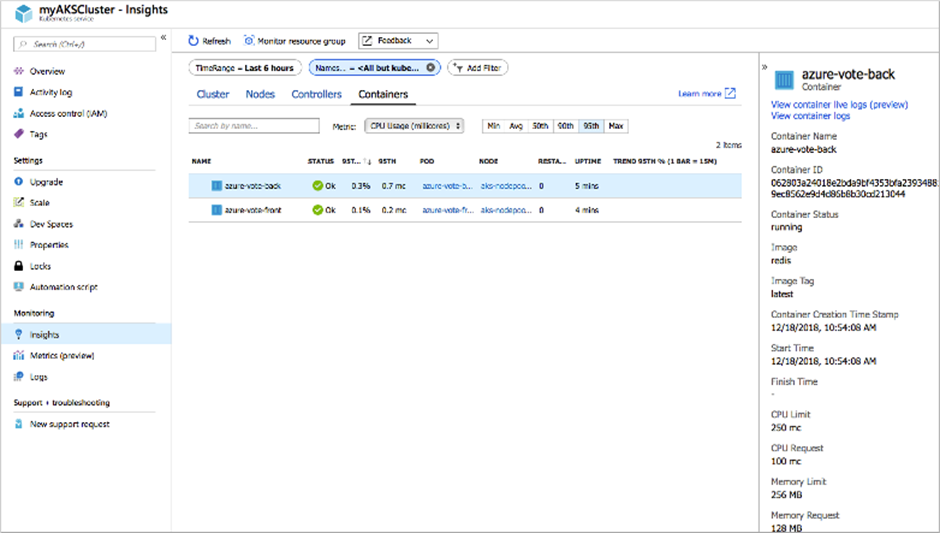
Container Insights is great for monitoring a Kubernetes cluster running with Azure Kubernetes Service (AKS). As mentioned, a Log Analytics Workspace needs to be connected which is the store for the monitored data. You can then get data through the Azure portal about which containers are running, where problems occurred and logs of the containers can be watched. Data about your nodes and node pools are also available.
VM Insights
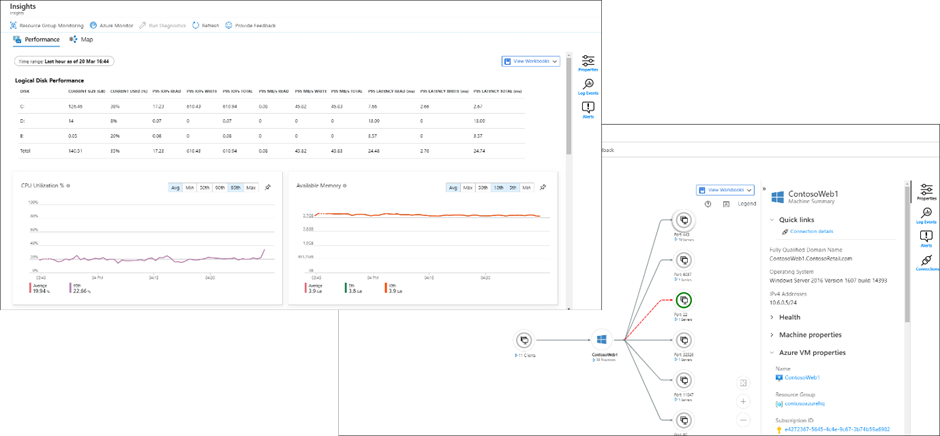
With VM Insights, available for Windows and Linux, you can monitor your virtual machines. It doesn’t matter if they are in the Azure Cloud, connected with Azure Arc or on-premises. Also for this insights topic a log analytics workspace is needed with an installed solution resource as well as the agent software on the machines.
VM Insights gives you the chance to view the metrics of your VMs, running processes and health status directly in the portal, for single machines or in a combined view. The Map feature can deliver great information about dependencies in the data traffic.
Performance & Map
More examples for insights under:
https://docs.microsoft.com/en-us/azure/azure-monitor/monitor-reference