
This is a series about the monitoring options for telemetry data in the Azure cloud. Not a deep dive, the intention is to show what is possible and what you have to keep in mind. It’s divided into multiple parts, easy to digest. After a brief site classification, the possibilities, from data types to data collection to usage, are explored.
Now in this first part, I’ll give a general overview with a little bit history and intodruce the data types.
Find the other parts under:
- Overview on Azure Monitoring-Part1-Intro
- Overview on Azure Monitoring-Part2-Levels and standard collection
- Overview on Azure Monitoring-Part3-Diagnostic settings
- Overview on Azure Monitoring-Part4-Virtual Machines
- Overview on Azure Monitoring-Part5-data sinks & costs
- Overview on Azure Monitoring-Part6-Log Analytics
- Overview on Azure Monitoring-Part7-Workbooks
- Overview on Azure Monitoring-Part8-Alerts
- Overview on Azure Monitoring-Part9-Insights
- Overview on Azure Monitoring-Part10-Examples
Overview Az Monitor Universe
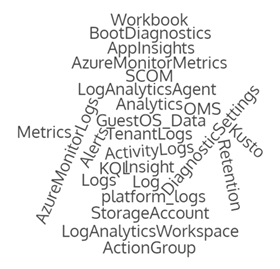
It’s not that easy to keep the overview in the Azure Monitor “Universe”. Many terms are not so clear defined and you can find them in other topics which have nothing to deal with Azure sometimes. To start little word cloud containing some of the most often used terms in Azure Monitoring:
History
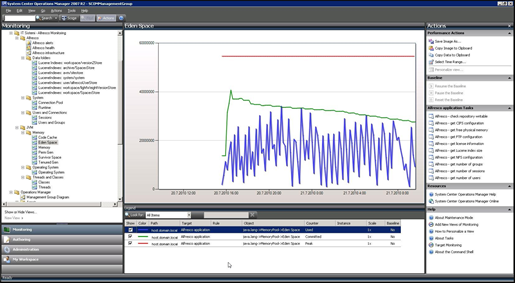
System monitoring tools have been and are available in the Azure Cloud. For a brief overview, a brief look into the past is risked. The journey through time begins in 2007. At the time, Microsoft introduced the System Center Operations Manager (SCOM). This allowed information from on-premises environments to be displayed about the state of virtual machines and networks and to view log data.
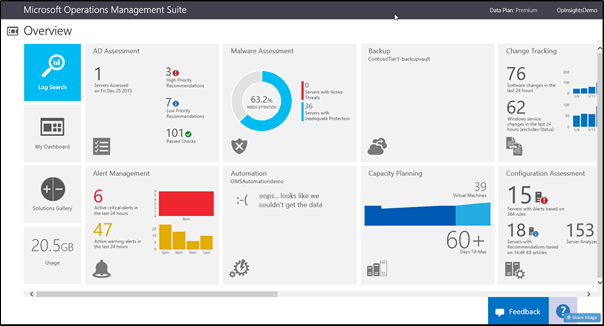
The system was replaced by the Operations Management Suite (OMS) in 2015, which was already available as a cloud solution as a monitoring tool, but in a separate portal, not the Azure main portal. In this solution, Term Log Analytics appeared for the first time, more on that later.
In the same year, Application Insights (App Insights) was also released as a separate resource for tracking web applications.
In 2018, an attempt was made to use Azure Monitor to unify the user’s experience in the portal to monitor applications, infrastructure, and network in one place.
Azure Monitor Overview
Azure Monitor is a standard service that always exists and does not need or can be provisioned as an extra resource in a resource group. The Azure Monitor offers a comprehensive set of monitoring options, including:
- Data connection from a wide range of sources
- Extensive analysis options
- Various further processing possibilities in the business process
For example, Azure Functions or Logic Apps can be used for further processing. The following graphic can be divided into three areas: the possible sources of data on the left, the data types in the middle, and the ways to work with that data on the right. You can also read here:
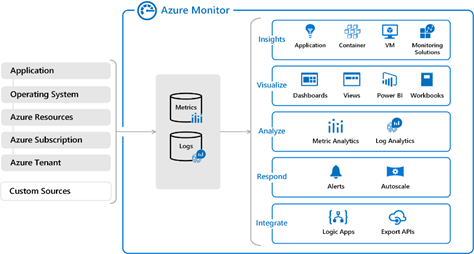
Data types and origin
Simply put, the monitor world knows numeric, decimal values, and text entries as data types, which are then called metrics and logs.
Metrics are data in time-series databases that are very lightweight and designed for real-time scenarios. Metric data provide e.B. information about the utilization of the CPU or memory of a virtual machine, here, for example, in case of limit values of the load, it must be able to react quickly with scaling.

The logs, which are represented by Data Rows in a relational table with column, are somewhat less time-critical. Many columns contain text in JSON format and can be broken even further in the analysis queries.

To read more in detail about metrics and logs, check:
https://docs.microsoft.com/en-us/azure/azure-monitor/essentials/data-platform-metrics
https://docs.microsoft.com/en-us/azure/azure-monitor/logs/data-platform-logs
To go ahead: Next part