
This is the part ten of the post series about the Azure cloud monitoring options for telemetry data. Here the topic are:
- Examples
- Service Now connection
Find the other parts under:
- Overview on Azure Monitoring-Part1-Intro
- Overview on Azure Monitoring-Part2-Levels and standard collection
- Overview on Azure Monitoring-Part3-Diagnostic settings
- Overview on Azure Monitoring-Part4-Virtual Machines
- Overview on Azure Monitoring-Part5-data sinks & costs
- Overview on Azure Monitoring-Part6-Log Analytics
- Overview on Azure Monitoring-Part7-Workbooks
- Overview on Azure Monitoring-Part8-Alerts
- Overview on Azure Monitoring-Part9-Insights
- Overview on Azure Monitoring-Part10-Examples
There are many possibilities for collecting and processing monitoring data. Simple but very efficient alarms are fired when the Break-Glass Account (MFA emergency concept) has been used for signing in. This is noted in the tenant logs and can notify the appropriate security team.
Incidents where an Azure Service Health Issue was generated at the subscription level are of interest to Operation Teams to see which of the used service maybe have an outage.
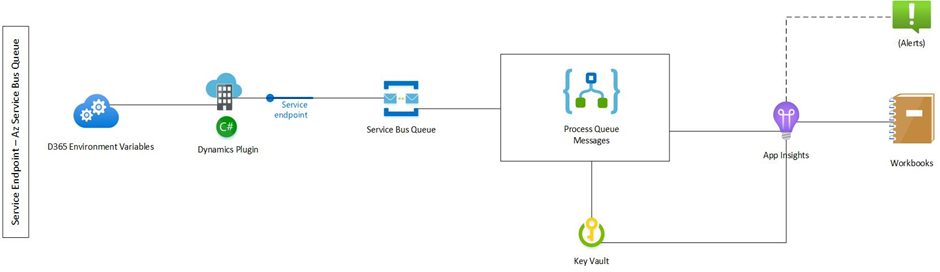
In another project case, custom Dynamics 365 plugins were extended, in which Trace Log data from the Sandbox plugin was sent to an Azure Service Bus Queue via a service endpoint. Processing the messages from the queue is handled by a Logic app, which generates an AppInsights Trace entry. A parameter-configurable workbook then enables performance and troubleshooting analysis for the plugins.
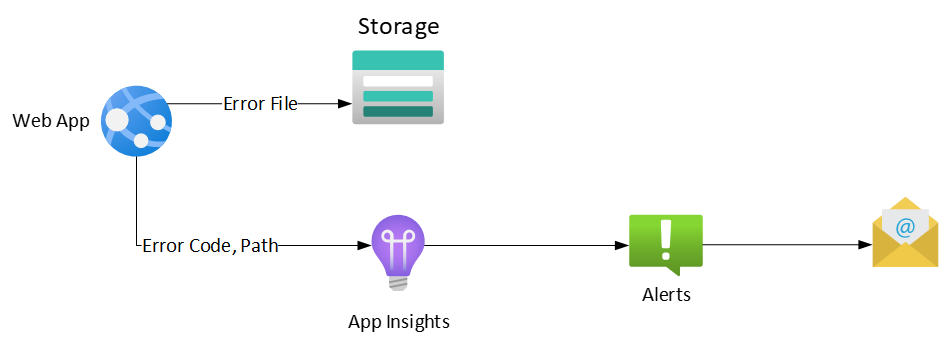
In an application-specific use case, if a file was not processed correctly, it was loaded into a blob storage and a corresponding log entry was written to the AppInsights with error code and path. A KQL Alert query was defined to search for the error key word and send the notification mail to the development team if an entry was found in the logs. The dev team gets direct access to the file through that.
Creating tickets in ServiceNow
One common approach is put the information from an Azure Alert into a service now ticket to handle the incident by the proper team. There are mainly 2 options to achieve that:
- Work with an action directly connected to ServiceNow
- Trigger a Logic App / Azure function make a http call to the ServiceNow api
Direct ServiceNow connection
The alert information can be handed over directly through the action part of the alert’s Action Group. You have to configure some things for that, on the Azure side and on ServiceNow side:
ToDo Azure:
- create an IT Service Management Connector resource
- Link a Log Analytics Workspace or create a new one
- (configure SNOW part at this point)
- Create an ITSM connection (can be found under the ServiceDesk(law-name) solution resource you created through the workspace linking) through providing the details from the ServiceNow config step.
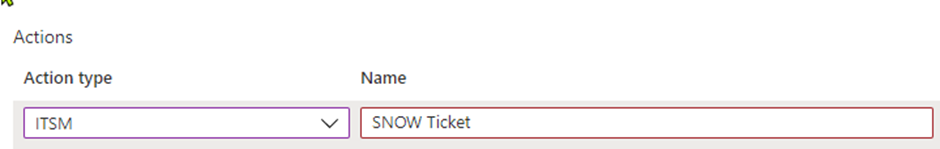
- Choose and configure ITSM Action in the Action Group you want to use
Detailed Information under: https://docs.microsoft.com/en-us/azure/azure-monitor/alerts/itsmc-definition#add-it-service-management-connector
ToDo ServiceNow :
- Create an OAuth API endpoint for external clients
- install User App for ServiceNow and Microsoft OMS Integration in your ServiceNow system (from ServiceNow store)
- Within the Microsoft OMS integrator part in ServiceNow , create an integration user to used for the connection
- (proceed with the Azure part)
Detailed Information under: https://docs.microsoft.com/en-us/azure/azure-monitor/alerts/itsmc-connections-servicenow
Rest Call:
There’s one downside for using the direct connection, because the Azure connector gets some rights on the snow system which is too privileged for many ServiceNow / Support teams. As used in own projects, a nice “workaround” is to use an Azure Logic App or an Azure Function to hand over the information through a rest call and creating the ticket within ServiceNow itself.
If you like to do so, just choose a Logic App in the action part of the Action group. The Logic App should be created with a http trigger using this body schema:
{
    "properties": {
        "data": {
            "properties": {
                "alertContext": {
                    "properties": {},
                    "type": "object"
                },
                "essentials": {
                    "properties": {
                        "alertContextVersion": {
                            "type": "string"
                        },
                        "alertId": {
                            "type": "string"
                        },
                        "alertRule": {
                            "type": "string"
                        },
                        "alertTargetIDs": {
                            "items": {
                                "type": "string"
                            },
                            "type": "array"
                        },
                        "description": {
                            "type": "string"
                        },
                        "essentialsVersion": {
                            "type": "string"
                        },
                        "firedDateTime": {
                            "type": "string"
                        },
                        "monitorCondition": {
                            "type": "string"
                        },
                        "monitoringService": {
                            "type": "string"
                        },
                        "originAlertId": {
                            "type": "string"
                        },
                        "resolvedDateTime": {
                            "type": "string"
                        },
                        "severity": {
                            "type": "string"
                        },
                        "signalType": {
                            "type": "string"
                        }
                    },
                    "type": "object"
                }
            },
            "type": "object"
        },
        "schemaId": {
            "type": "string"
        }
    },
    "type": "object"
}
The JSON is parsed out of the box and the items can be used for mapping the payload for the snow call. So very basically, it can be done with 2 steps. But for sure you can add more, for example accessing a Key Vault for credentials.
Outlook
So that’s it for the monitoring series so far, 10 parts to get an overview what’s possible with Azure monitoring, although there’s for sure much more to write about. Hope I could give some good insights in the monitoring universe.
Unification of the monitoring options of telemetry for Azure Cloud or on-premises environments in Azure Monitor is progressing. Resources are merged or simplified, and more insights enhancements are also on the way. Let’s see what the future brings.