
This is the fifth part of the post series about the Azure cloud monitoring options for telemetry data. Here the topics are:
- Data sinks
- Costs of telemetry data
Find the other parts under:
- Overview on Azure Monitoring-Part1-Intro
- Overview on Azure Monitoring-Part2-Levels and standard collection
- Overview on Azure Monitoring-Part3-Diagnostic settings
- Overview on Azure Monitoring-Part4-Virtual Machines
- Overview on Azure Monitoring-Part5-data sinks & costs
- Overview on Azure Monitoring-Part6-Log Analytics
- Overview on Azure Monitoring-Part7-Workbooks
- Overview on Azure Monitoring-Part8-Alerts
- Overview on Azure Monitoring-Part9-Insights
- Overview on Azure Monitoring-Part10-Examples
Data sinks
There are two main data sinks or pots where the telemetry data can be stored, although also the Storage Account should be at least mentioned as store e.g. for boot diagnostics data. But often, that’s not the end of the data chain, because querying and getting insights is not so comfortable. You mainly store your log and metric data in a Log Analytics Workspace or a Application Insights resource, depending on the resources you want to monitor.
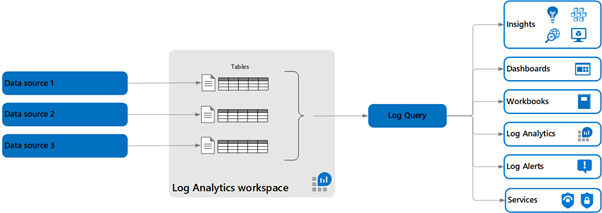
Log Analytics Workspace
An Azure Log Analytics Workspace is a central datastore for log and telemetry based on the Azure Explorer database. Depending on the configured source, there are different tables in which the data is available after the connection. Table names are given and not editable. Regarding the screenshot, an AKS cluster is connected and update management for a virtual machine is configured, for example.
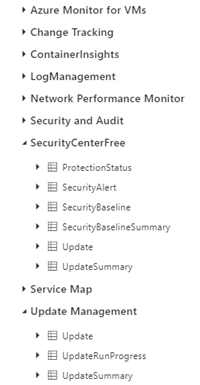
The retention duration of the data can be set, for a workspace up to 730 days. At least one workspace is required to use the Log Analytics feature—or an Application Insights instance for working with the data (see following posts).
For sure, one common scenario is the collection of virtual machine data. But the source for data can also be the Azure Active directory, an Application Gateway or an AKS cluster.
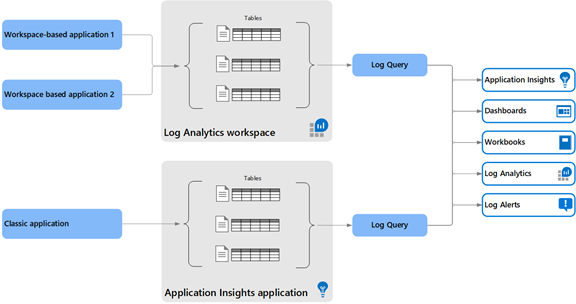
Applications Insights
The other data pot to mention in connection with the monitoring comes from the Application Insights resource. I’ll write more about this service in another post of this series. Here too, the Data Explorer is the basis and the specific data is stored in the respective tables. Because AppInsights has been consplicated as an easy-to-integrate web application monitoring solution, there are tables for requests, exceptions, and traces. In the meantime, a fusion has also been started here, it can now be chosen between the “classic” variant, which corresponds to the stand-alone data pot, or the workspace variant. In this case, AppInsights also uses tables in an existing workspace. However, it should be noted that the tables and fields have different names. Mapping information can be found at https://docs.microsoft.com/en-us/azure/azure-monitor/app/apm-tables
Classic Application Insights data collection:
Costs for telemetry data
Regarding my experiences in projects, collecting Azure telemetry data can be an expensive adventure. Scenarios for unforeseen costs are e.g. loop-like errors of an application, which in turn produce a lot of log data. Or you have simply connected to many sources like virtual machines.
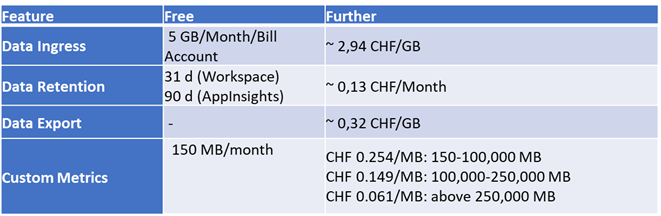
The costs are largely composed of data input and its retention period. Both the Log Analytics Workspace and AppInsights offer first 5GB of free input and 31 days and 90 days of free retention, respectively.
To prevent costs from spiraling out of control, you can set daily data limits for Applications Insights and the Workspace or configure a storage account for archiving for a longer period of time. Capacity reservations are also possible for the Log Analytics Workspace, as with virtual machines. However, these are only useful for large amounts of data.
Not completely, but the main cost drivers:
It also costs some money to query the data. Find out more under https://azure.microsoft.com/en-us/pricing/details/monitor/