This is the part number eight of the post series about the Azure cloud monitoring options for telemetry data. Here the topics are:
- Monitor Alerts

Find the other parts under:
- Overview on Azure Monitoring-Part1-Intro
- Overview on Azure Monitoring-Part2-Levels and standard collection
- Overview on Azure Monitoring-Part3-Diagnostic settings
- Overview on Azure Monitoring-Part4-Virtual Machines
- Overview on Azure Monitoring-Part5-data sinks & costs
- Overview on Azure Monitoring-Part6-Log Analytics
- Overview on Azure Monitoring-Part7-Workbooks
- Overview on Azure Monitoring-Part8-Alerts
- Overview on Azure Monitoring-Part9-Insights
- Overview on Azure Monitoring-Part10-Examples
Structure of Alerts
Continuing talking about the options you have to work with the monitoring data, here we go with Azure Alerts as another essential part of data processing. As the same suggest, something of our interest happened and we want to know what.
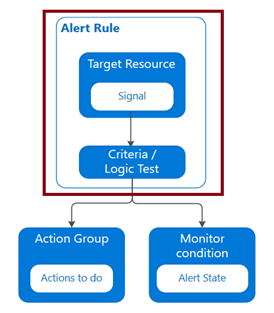
An alarm consists of three areas:
- Source / Scope
- Condition / criterias
- Notifications / Actions
Source / Scope
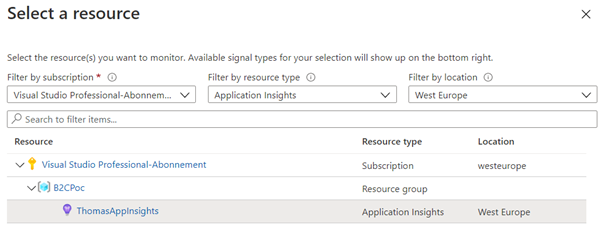
First, a subscription or resource must be chosen, defining the scope we want to investigate. Depending on this scope, different signals types can be used to build the Alert on. A subscription allows working on Activity logs, e.g. picking up a specific administrative operation event (e.g. resource was created). If you select a Virtual Machine for example, also metric data like CPU usage are available and an Application Insights resource adds collected Log data.
In short summary, an Alert is always based on the available monitoring data.
Condition / criterias
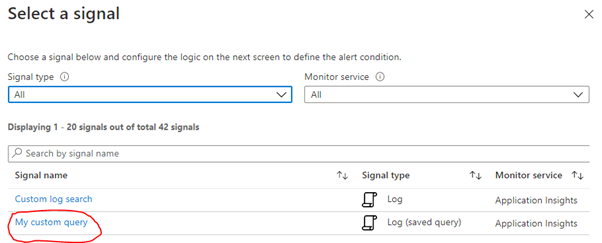
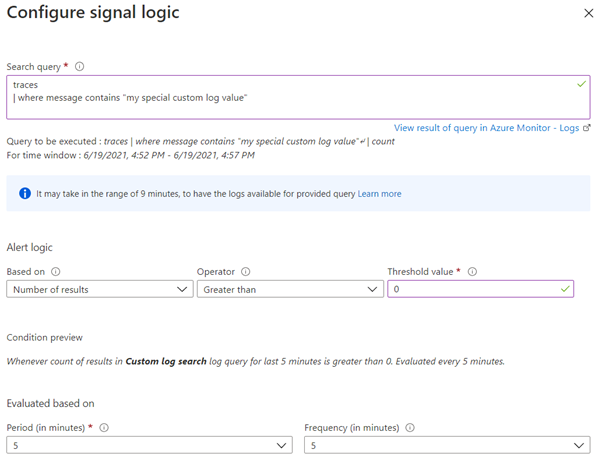
The second step, the condition block, the signal has to be selected.
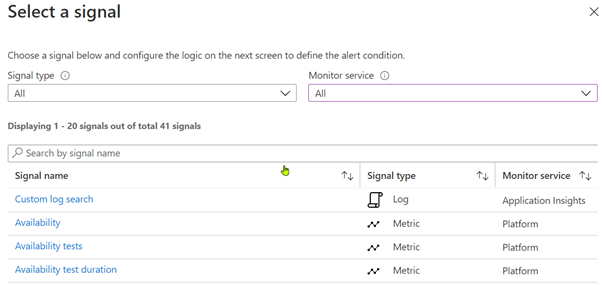
After signal selection, the criteria when the Alert shall be raised needs to be defined.
Depending on the type there are different options. For activity logs the event levels can be important. For Metrics is it a threshold value, for Logs the number of result rows or the evaluated time period and polling interval for both.
Notifications / Actions
The third block defines the circle of people to be notified and how they should receive the notifications. This is done with Action Groups, the creation and definition are straight forward. Usual behavior is a notification by email, through selecting RBAC roles or specific users. But also SMS is possible for notification, for example. Keep in mind that the SMS service is only available every 5 minutes. By configuring Actions, further automation in the business process can be defined. If the alarm occurs, e.g. code can be executed by Azure Functions, web hooks and runbooks, a Logic app could be triggered or a ticket in a connected ITSM could be generated.
Alert states
Finally, you can / should manage Alerts depending on their state, which is possible in the Monitor portal. Available states are
- New (raised by the system)
- Acknowledged (indicates a responsible person takes care of the Alert)
- Closed (Alert was handled)
To dive further into Azure Monitor Alerts, check:
https://docs.microsoft.com/en-us/azure/azure-monitor/alerts/alerts-overview
Attention on working with Alerts
Hidden resources
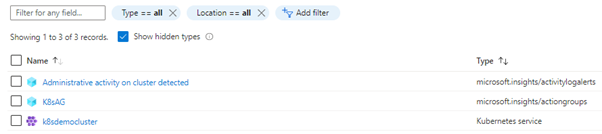
Like almost everything in Azure, Action Groups and Alert Rules are resources themselves, but they are hidden by default and may need to be made visible through the appropriate checkbox, for example for a resource move.
(Unintended) pre-filtering
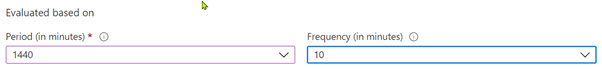
In addition, the configuration of the query period in the alert already pre-filters the data – whether the query used actually looks into the past much longer is irrelevant.
Relating to following example, the last 24h are within the queried timeframe. It doesn’t matter if the query itself defined a timeframe of maybe the last 3 days.
Query usage
Another pitfall lurking here is relating to query usage. A KQL query, saved and managed in Log Analytics, can be used. But it is only copied and not referenced. Therefore, changing the query in Log Analytics has no impact for the Alert rule.