
This is the third part of the post series about the Azure cloud monitoring options for telemetry data. Here the topic is:
- Enhanced Collection: Diagnostic settings
Find the other parts under:
- Overview on Azure Monitoring-Part1-Intro
- Overview on Azure Monitoring-Part2-Levels and standard collection
- Overview on Azure Monitoring-Part3-Diagnostic settings
- Overview on Azure Monitoring-Part4-Virtual Machines
- Overview on Azure Monitoring-Part5-data sinks & costs
- Overview on Azure Monitoring-Part6-Log Analytics
- Overview on Azure Monitoring-Part7-Workbooks
- Overview on Azure Monitoring-Part8-Alerts
- Overview on Azure Monitoring-Part9-Insights
- Overview on Azure Monitoring-Part10-Examples
Enhanced Collection
In advanced monitoring, the term Diagnostic Settings comes into use, which corresponds to the name of a configuration setting.

Here you can set at the resource level which of the tangible data should be sent either to
- a Storage Account
- a Log Analytics Workspace
- an Event Hub resource,
- a partner solution
Last named means the usage of Apache Kafka for Confluent Cloud, Datadog or Elastic. To read more about partner solutions, check https://docs.microsoft.com/en-us/azure/partner-solutions/overview
Without creating Diagnostic Settings for resources, needed telemetry data is not available at all or not long enough for the business purpose.
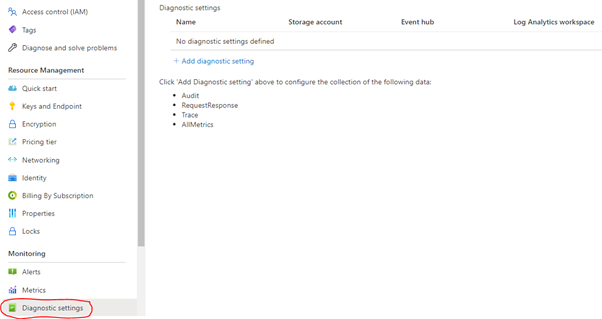
Diagnostic Settings can be reached easily in the Azure portal under the Monitoring section of a resource. You can activate it also with the Azure Powershell, the Azure CLI or ARM templates, of course. You can configure multiple diagnostic settings for each resource.
There are some considerations to be done regarding the region of the data sink. A storage account, for example, needs to be in the same region as the monitored resource. The same is valid for an Event Hub, while that’s not relevant for the Workspace.
The data that can be collected depends on the resource. A storage account provides additional telemetry about the number of transactions and their source, a web application firewall can provide detailed insight into captured requests, matching rules, and blocking actions.
Creating a diagnostic setting is quite easy. Click on add , choose a name, the data category which you want to collect and one or more data destinations:
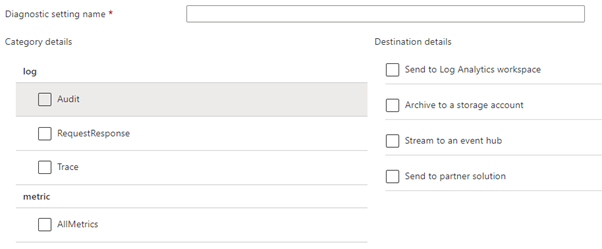
After activation a destination, the user is requested to pick an existing resource.
Choosing a storage account as data sink let you configure the desired retention time of the data directly. A value of 0 indicates that the data is kept forever. The retention for a Log Analytics Workspace is handled within that resource.
Find additional information at diagnostic setting