This is the sixth part of the post series about the Azure cloud monitoring options for telemetry data. Here the topics are:
- Log Analytics
- KQL
- Try out with sample data
Find the other parts under:
- Overview on Azure Monitoring-Part1-Intro
- Overview on Azure Monitoring-Part2-Levels and standard collection
- Overview on Azure Monitoring-Part3-Diagnostic settings
- Overview on Azure Monitoring-Part4-Virtual Machines
- Overview on Azure Monitoring-Part5-data sinks & costs
- Overview on Azure Monitoring-Part6-Log Analytics
- Overview on Azure Monitoring-Part7-Workbooks
- Overview on Azure Monitoring-Part8-Alerts
- Overview on Azure Monitoring-Part9-Insights
- Overview on Azure Monitoring-Part10-Examples
Working with the data
Now it’s getting serious. The data sink was chosen, the sources are connected and send data – now it’s time to generate value out of the data.
The first area I want to cover for telemetry data analysis is the option to query them. For that, you have Log Analytics and KQL.
Log Analytics
When it comes to the central question of what can be done with the collected data, the term log analytics inevitably appears, which can be somewhat confusing due to its history and sources on the net.
In this context, it refers to the part of the Azure Portal where KQL queries can be used and managed and should not be confused with the Log Analytics Workspace resource itself or Log Analytics as part of an OMS Suite.
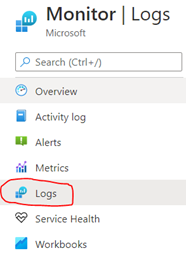
To start with Log Analytics, you need to select the scope (the data sink you want to analyze). This is done automatically, if you select <Logs> from the resource itself. If you go the generic way over Azure Monitor, you’re prompted to choose the scope.
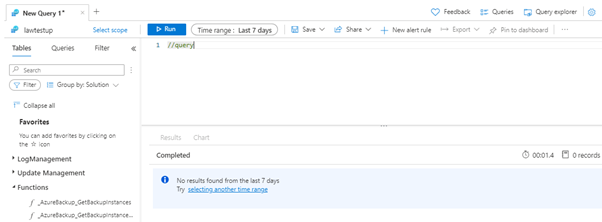
In Log Analytics, you’ll find kind of a little IDE. On the left hand you can see:
- the tables available (depending on the selected scope),
- query examples
- defined functions and
- filter options
Functions are an option to nest queries, you can define a query and save it – as a query or as a function to call in with parameters in another query.
To know more, check https://docs.microsoft.com/en-us/azure/azure-monitor/logs/functions
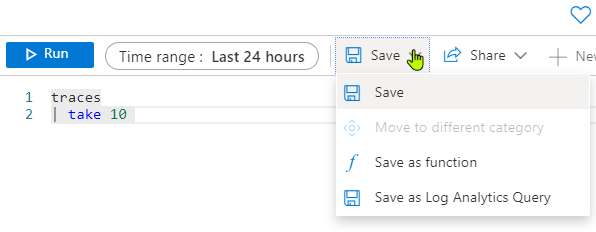
On the top, you can add tabs for different queries, set the regarded timeframe (also possible in the query itself), save and export the query. You can browse your saved queries within the Query explorer on the right.
In the middle you can find the windows for query writing and the results. Click on <Run> or hit shift + enter to execute the KQL query.
KQL
KQL can be confusing, too. It’s neither Keyword Query Language nor the Kibana Query Language.
Here, KQL is the Kusto Query Language designed for Data Explorer. It is similar to SQL and is optimized for reading queries of large amounts of data. DDL operations such as creating your own tables are resource-restricted to the Data Explorer or the Data Collector API from the workspace. KQL is also used for queries in the Resource Graph.
A KQL query follows the scheme of choosing a table or join, optionally extended (“piped”) via conditions and projections (selects). The pipe operator | continues to provide interim results.
For example, the equivalent of the MSSQL query:
SELECT operation_Name, type, method
FROM exceptions
WHERE operation_Name = "Myfunction"
would be in KQL:
Exceptions
| where  operation_Name == "Myfunction"
| project  operation_Name, type, method
Available structures are, for example:
Conditions
- Where, equals, in, or
Search
- All tables, specific tables, case (in)sensitive, wildcards
Group
- Summarize, avg, max, bin
Select
- Project, extend, project-away, top, take, limit, distinct
Charts
- Time chart, pie chart, bar charts
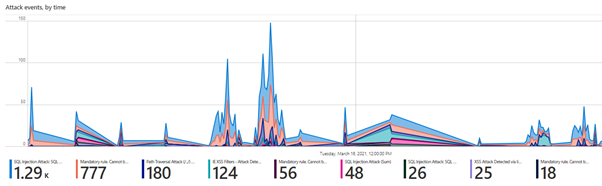
Very interesting (or just great) are the various ways to generate charts from the query results. Just another pipe, state the chart type you like and the result is displayed in form of a chart instead having a table.
Analysis of Web Application Firewall logs with rendered timechart:
Read more details under:
https://docs.microsoft.com/en-us/azure/data-explorer/kusto/concepts/
Go and test yourself!
To simply test and get experiences with KQL, you can check the example Log Analytics pages from Microsoft, where some test data – simultating an Application Insights resource or a Log Analytics Workspace – is provided for you.
Saving queries is not possible, but you can get in touch with Log Analytics and KQL free of charge, without deploying any resources.