This is the fourth part of the post series about the Azure cloud monitoring options for telemetry data. Here the topic is:
Find the other parts under:
- Overview on Azure Monitoring-Part1-Intro
- Overview on Azure Monitoring-Part2-Levels and standard collection
- Overview on Azure Monitoring-Part3-Diagnostic settings
- Overview on Azure Monitoring-Part4-Virtual Machines
- Overview on Azure Monitoring-Part5-data sinks & costs
- Overview on Azure Monitoring-Part6-Log Analytics
- Overview on Azure Monitoring-Part7-Workbooks
- Overview on Azure Monitoring-Part8-Alerts
- Overview on Azure Monitoring-Part9-Insights
- Overview on Azure Monitoring-Part10-Examples
Virtual machines data
VMs often play a central role in a cloud environment. When monitoring these, performance counters such as CPU or RAM usage are interesting, of course. But there quite a few more data options to collect from a virtual machine:
- Performance counters
- Boot diagnostics
- Event Logs (Windows)
- Sys Logs (Linux)
- Crash dumps
- Network traffic
The Event or Sys Logs are very important for further evaluation in security solutions such as the Azure Securtiy Center or Azure Sentinel.
VM Monitoring Agents
If telemetry data from virtual machines should be collected, the overview can be quickly lost here because of different needed agent software installations. There are currently 5 different software modules (agents) available to capture system logs, process information, or network traffic.
The agents have differences regarding the data they send, but they are also overlapping on the other side. Some work only on Azure and some also on-premises, natively or via Azure Arc.
Log Analytics agent
- Sends data to the Log Analytics Workspace. Used for Update Management, Change Tracking, State configuration, Security Center, Azure Sentinel
Azure Monitor agent (preview)
- Sends data to Azure Monitor. Used for Log collection and performance tracking
Diagnostics extension
- Sends data to Storage, Az Monitor Metrics, Event Hub. Used to view logs, crash dumps, IIS logs
Dependency agent
- Uses the log analytics Agent to send data. Used to view processes on a VM, external process dependencies or network metrics
Telegraf agent (Linux)
- Sends data to Azure Monitor Metrics. Used for performance tracking
Typically, a Log Analytics Workspace Agent is used at the moment, which is planned to be replaced by the Azure Monitor agent (currently in preview)
More detailed descriptions can be found at agents-overview
To have an overview how the VM monitoring can look like in a system architecture, see following picture:
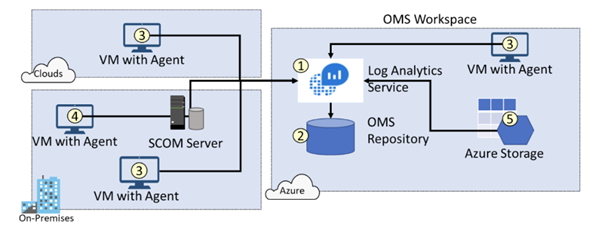
VMs can be monitored (with Agent installed) on their own, regardless they are in the cloud or on-premises. Also an integration over a SCOM installation is possible and data from a collecting storage account (e.g. boot diagnostics) can be integrated “back” to the Log Analytics Workspace again.
Agent installation:
There are several options to install the agent software on the virtual machines:
- Manually via the installation packages
- With Azure Policy
- Via auto provisioning setup in the Azure security center (uses Deploy if not exists policy under the hood)
- With DSC configuration
- Through an activated virtual machine extension
For more detailed information including requirements on network, firewall and proxy configuration check:
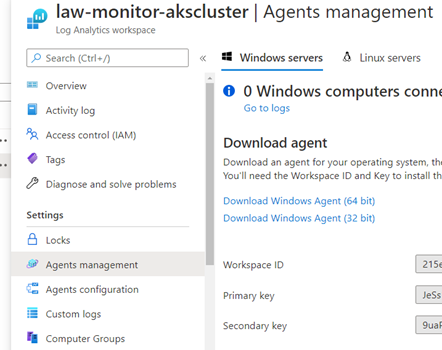
Regardless which option was chosen for installation, the Agents must be configured to be able to send the data to the workspace. To accomplish that, the workspace ID and the key is required, which can be found in the Agents management section of the workspace resource: