
This is the part No. 7 of the post series about the Azure cloud monitoring options for telemetry data. Here the topic is:
- Workbooks

Find the other parts under:
- Overview on Azure Monitoring-Part1-Intro
- Overview on Azure Monitoring-Part2-Levels and standard collection
- Overview on Azure Monitoring-Part3-Diagnostic settings
- Overview on Azure Monitoring-Part4-Virtual Machines
- Overview on Azure Monitoring-Part5-data sinks & costs
- Overview on Azure Monitoring-Part6-Log Analytics
- Overview on Azure Monitoring-Part7-Workbooks
- Overview on Azure Monitoring-Part8-Alerts
- Overview on Azure Monitoring-Part9-Insights
- Overview on Azure Monitoring-Part10-Examples
Workbooks
Azure Monitor Workbooks are an own resource in Azure. Simply put, a workbook is a dashboard.
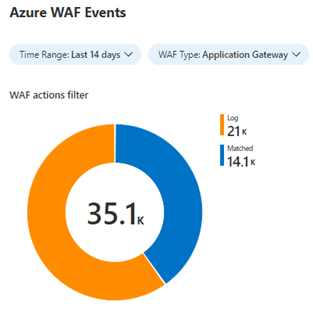
Here, a page can be divided into sections and e.g. the results of KQL queries can be displayed together in the desired arrangement, as tables or charts. In addition, search manipulation parameters can be used and various filtering and sorting options are available. Query results can be concatenated, for example, clicking on a bar of a chart can change the results of a detail table. There are also many auto-formatting options available, as heat map coloring for column values, for example.
It’s not only to display query results, with the help of the Resource Graph you can access many other areas of your Azure environment like subscriptions or resources.
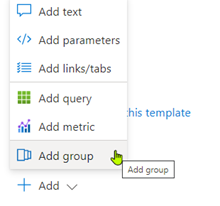
One single item within a workbook can be added via the corresponding button. You can choose between:
- Text
- Parameters
- Links and tabs
- Add a query
- Add a metric
- Group
All workbook items have an area for basic and advanced settings and a styling section.
Items can be cloned. They can also be re-arranged with the <move> option.
Item options
Here I just want to give a little overview of what item types you can work with. How to use them, I’ll write more in detail soon.
Parameters
Parameters are great to filter your workbook. You can choose between a wide range of options. A parameter can be a single textbox value, a dropbox or a time range picker, just to give a few examples. The parameter values can then be used in queries.
Links and tabs
Links or tabs are an option to keep the overview in the workbook. You can jump to anther section in the workbook or encapsulate views of some items, activated by a tab. This works in combination with groups.
Query
Simply put a query tested in Log Analytics in a workbook item and view the result in table form or with rendered charts. Here you must be a bit careful, the chart render results are not exactly the same as in Log Analytics direct, so check the result in the workbook.
To add Excel exports and Filters for table views you just need to enable it the query settings. Sorting for columns work out of the box.
Metric
Same as for queries, you can insert a metric chart in workbook in the way you build it in the metrics section of a resource. Pick a resource, one or more metrics types and a time range, that’s it.
Group
As mentioned in the tabs section, grouping is good to keep the overview. A group, as the name says, just combines a set of items. You display groups based on a chosen tab, e.g.
ARM template export/import
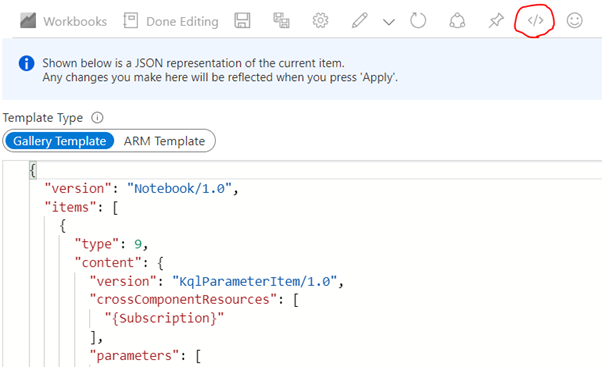
Azure Workbooks are based on JSON. You can enter the advanced editor through clicking on </> which makes the whole code for the Workbook content itself as well as the complete ARM template to create the Workbook resource available. Editing and applying the changes is directly possible, but it’s more useful for exporting the code or copy-pasting entire workbooks (especially in the ARM view, the workbook content is a single line and not readable).
Example workbook structure
Form top to bottom, you could start with a parameter item for an initial filtering of the workbook based on a time range or a specific value.
Then, maybe representing different stages, groups activated per tab to keep a good overview.
Displaying a set of results from a query as a bar chart and working with the “clicked” values from the bars in anther query in table form could be one of the next options. In the table views, export of the data could be made available.
Hint: I already had the problem with script bugs on the portal page, where the data forwarding per click didn’t work. So, before struggling some hours what you did wrong [as me (-; ] always check the browser’s developer tools for script errors. If that happens, you can try it with a Microsoft support request. This dynamic feature also can also cause problems with some specific and more restrictive browsers like the Brave one.
You can start with an empty Workbook or have a look into one of the templates from the workbook gallery. In another post I’ll write something about build-in Workbooks for various Insights areas.