This is the second part of the post series about the Azure cloud monitoring options for telemetry data. Here the topics are:
- Monitoring Levels
- Available standard data
Find the other parts under:
- Overview on Azure Monitoring-Part1-Intro
- Overview on Azure Monitoring-Part2-Levels and standard collection
- Overview on Azure Monitoring-Part3-Diagnostic settings
- Overview on Azure Monitoring-Part4-Virtual Machines
- Overview on Azure Monitoring-Part5-data sinks & costs
- Overview on Azure Monitoring-Part6-Log Analytics
- Overview on Azure Monitoring-Part7-Workbooks
- Overview on Azure Monitoring-Part8-Alerts
- Overview on Azure Monitoring-Part9-Insights
- Overview on Azure Monitoring-Part10-Examples
Levels of contemplation
The data can also be categorized regarding its origin. That leads to different levels, where the logs and metrics occur:
- Tenant (AAD Logs)
- Subscription (Activity logs)
- Ressource Level (Diagnostics Settings)
- Guest OS Data
- Application level
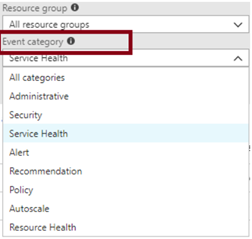
For example, there are the Active Directory Logs that are generated at the tenant level, such as sign-in user activities. When looking at the subscription level, we have activity logs. Here, administrative operations on the same, security-related messages or information about scaling curtains should be mentioned. It also collects data about the general health of Azure Services in this scope. This could be, for example a message about a temporary service failure.
The resource level contains relevant metrics and resource configuration changes. A small special case here are the Guest OS data from virtual machines such as performance counters, event logs and boot diagnostics. For more information, see the VMs section. At the application level, such as a .Net Core web application, data about the behavior of the code can be collected – with the usual suspects such as exceptions, requests, or debugger information.
Example architecture for solution monitoring
Regarding the different levels of the telemetry data, following solution architecture could be used:
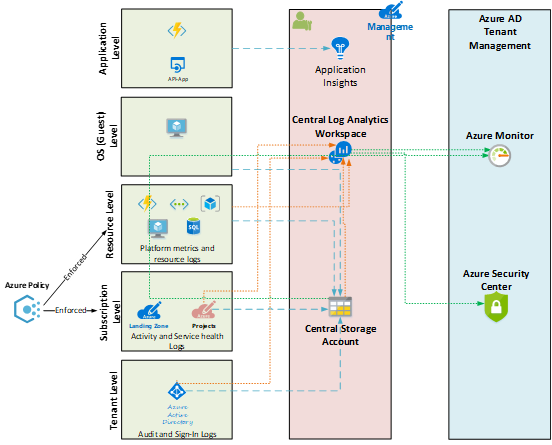
The data is either send to a Log Analytics Workspace, a Storage account or an Application Insights resource (AppInsights can be provisioned workspace-based now, see feature post in this series). On the consumer side, Azure Monitor parts like Log Analytics or the Azure Security Center should be mentioned. Last named can give you security recommendations, for example because of collected virtual machine event data.
Azure Policy is a great instrument to enforce and configure telemetry data collection for different levels automatically.
See Azure Policies for more details about that.
Data Collection options
Standard Monitoring
Some data is collected out-of-the-box and can then be queried as part of their retention time. This again is very different, while Activity Logs are kept in the Azure environment for 90 days by default – metrics 93 – tenant logs are only available for 30 days. If longer access is required here, these must be transferred to another data store as part of the extended monitoring. If you do that, have a eye on the occuring costs.
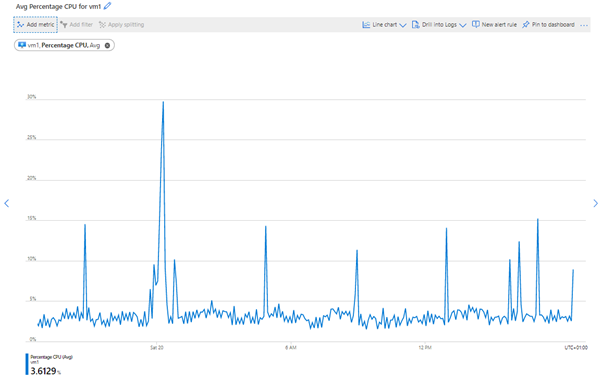
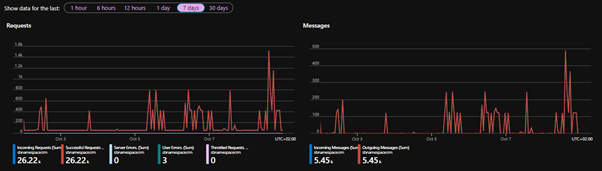
To give some simple examples for resource specific standard data: if a service bus is provisioned with a queue, you can see how many messages have passed through the bus over time from the menu of the resource itself or from the Monitor Service with the corresponding scope. Having an AppService or a virtual machine, you can view the performance metrics through the portal.
Service Bus Traffic:
Virtual machine metrics – CPU usage: