This is the fourth part of the blog series which introduces the Azure Kubernetes Service (AKS).
Overview on the series:
- AKS Part 1 – general terms and availability options
- AKS Part 2 – network, storage and tools
- AKS Part 3 – security topics
- AKS Part 4 – scaling and monitoring
- AKS Part 5 – advanced integration with other services
- AKS Part 6 – cluster architecture, hints & tricks and hands-on
In this part, the topics are:
- Scaling
- Monitoring
HPA and Cluster Autoscaler
In a container-based microservice architecture, scaling the pods or the entire cluster is also a significant issue where AKS can help with additional techniques. The Horizontal Pod Autoscaler (HPA), which scales based on pod metrics such as CPU usage to create and remove pods on a node, is already known from K8s itself.
But AKS also has a cluster autoscaler. This can automatically add or remove new nodes from the cluster as resource usage on the virtual machines requires. The autoscaler can be activated via the portal or simply via CLI, as can be seen in the following code snippet for a cluster with a single node pool. It can be used to automatically scale between one and three nodes, with different profiles allowing for more granular scaling. The additional nodes do not require any further configuration.[1]
az aks update --name $aksClusterName --resource-group $rgName --enable-cluster-autoscaler --min-count 1 --max-count 3
In addition, there is the Kubernetes-based Event Driven Autoscaling (KEDA) framework for scaling, which allows further extensive metrics and events as triggers. KEDA creates additional pods for operating and event listening in the cluster and works together with the HPA. This means that many other signals can be used for pod scaling, e.g. Azure Monitor metrics, storage or event hubs. Other event sources from other cloud providers are also supported[2].
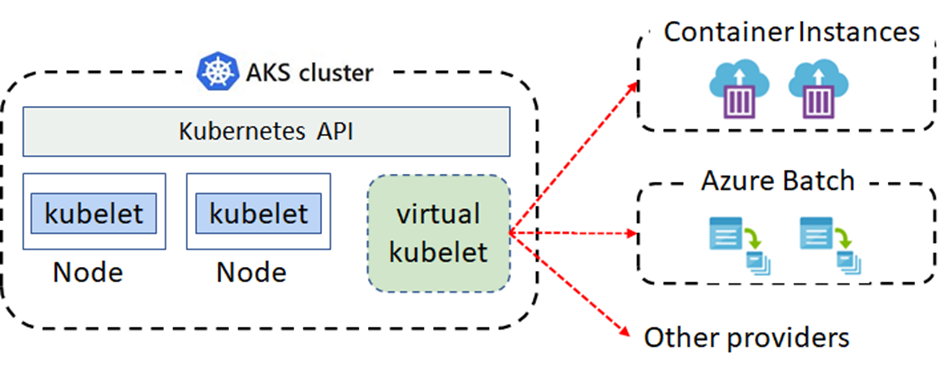
Rapid Burst Scaling
Scaling via nodes can simply be too slow under certain circumstances. For this use case, virtual kubelets can be used[3]. This is an open-source Kubernetes implementation that can be used to simulate nodes in the cluster; a kubelet then registers itself as a node. The necessary computing power behind the virtual kubelets does not come directly from virtual machines, but for example from the Azure Batch Service with GPUs or from Azure Container Instances on which the containers run. This is more expensive, but scales much faster than via the node scaler. This is where the name rapid burst scaling comes from, because it is designed more for balancing peak loads and not as a permanent state.[4]
Azure Monitor with AKS
AKS offers convenient options for monitoring the cluster through integration in the Azure Monitor. For the most comprehensive data, the cluster is linked to an Azure Log Analytics Workspace, which represents the central data sink. If the corresponding diagnostic settings of the cluster are activated, log data from the API server, the controller manager or the scheduler can be collected in addition to metric data such as CPU utilisation, disk occupancy or network traffic.
As known from the monitor world, numerous tools are available for analysing this data. The data can be visualised in Monitor Workbooks or via Power BI, for example. The cluster can also scale based on the data and there are options to send notifications via alerting. If required, even further work steps can be carried out via Azure Functions, Logic Apps or connected ticket systems like Service Now.
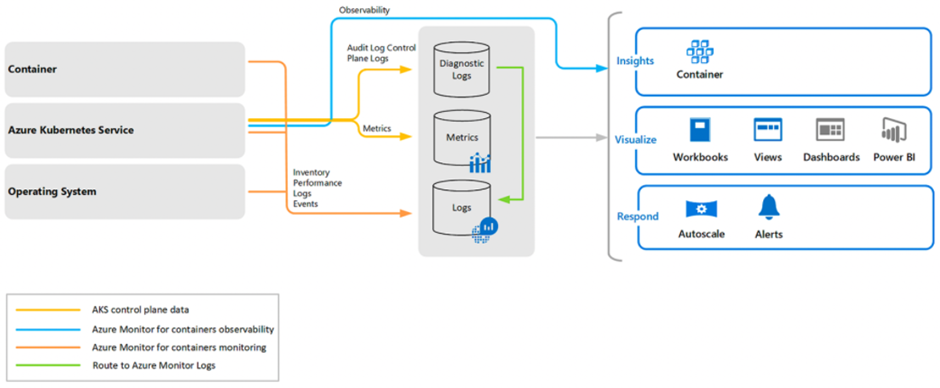
Microsoft provides insights into the status of nodes, containers or their live logs, among other things, via the Container Insights Solution, which is based on existing workbooks. The monitoring add-on can also be activated after the cluster has been created.
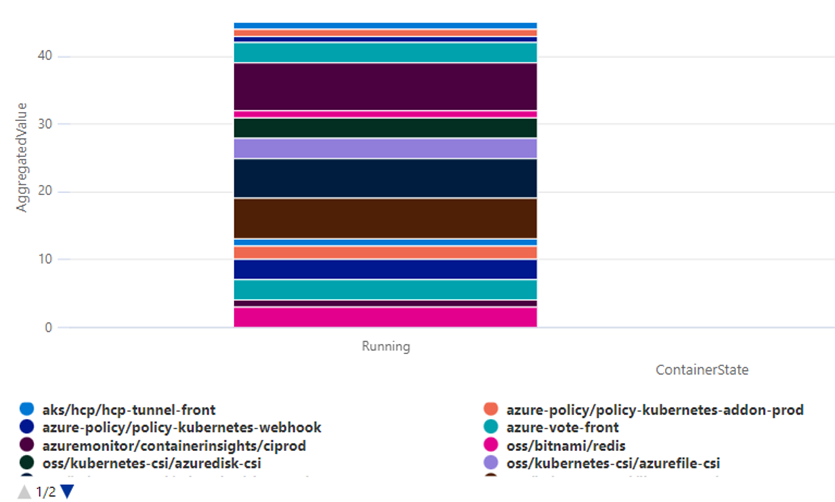
The Kusto Query Language (KQL), an SQL-like query language from the Azure Monitor world, also offers many options for individual analysis. Queries for information from the cluster can then be executed directly in the Log Analytics area of the Azure Portal.
The following query provides basic data about containers running in the cluster for the last 30 minutes and renders a chart directly:
ContainerInventory | where TimeGenerated >= ago(30m) | summarize AggregatedValue = dcount(ContainerID) by ContainerState, Image | render columnchart
[1] https://docs.microsoft.com/en-us/azure/aks/cluster-autoscaler
[2] https://keda.sh/docs/2.4/scalers/azure-monitor/
[3] Virtual Kubelet Introduction – https://azure.microsoft.com/en-us/resources/videos/azure-friday-virtual-kubelet-introduction/
[4] https://docs.microsoft.com/en-us/azure/aks/concepts-scale